Continued population growth, with low unemployment and low interest rates will continue to underpin house prices in Australia over the next three years, according to the QBE Australian Housing Outlook.
The weakening we’ve seen in the Sydney and Melbourne market over the past 12 months is off the back of double digit growth in three of the four preceding years. The report forecasts this softening to continue in the next one to two years, followed by some strengthening towards the end of the forecast period.
Sydney

Limited supply, a low interest rate environment and robust investor demand led to strong price growth in Sydney over the five years to June 2017. The median house price peaked at $1,194,800 over this period, growing by a cumulative 84% (or roughly 13.0% per annum).
However, supply is now rising. Annual dwelling completions in New South Wales (NSW) over the two years to June 2018 were 113% higher than the 10-year average between 2006 and 2016, and the NSW dwelling shortage has begun to fall sharply through 2017/18. In Sydney, vacancy rates have increased to 2.5% as at the June 2018 quarter, up from 1.8% 12 months earlier.
The increase in vacancy rates has been most significant in the middle ring suburbs where the vacancy rate increased to 2.8% in the June quarter—the highest level since September 2012. This comes as the middle ring suburbs have experienced the greatest increase in new apartment supply through this cycle.
An uptick in dwelling completions and slowing population growth have reduced upward pressure on prices. Together with tightened credit conditions, house prices declined in 2017/18 for the first time in six years. The Greater Sydney median house price at June 2018 was $1,103,500, representing a 7.6% decline on a year earlier. After seeing the strongest price growth in the 12 months prior, the inner and middle ring suburbs of Sydney have seen the largest fall in prices over 2017/18 (falling by 8.1% and 10.6% respectively).
Outer Sydney saw a more moderate decline of 2.8% over the same period, which was likely supported by its relative affordability appealing to first home buyers.
Read more about Sydney property prices: download the report.
Melbourne

Melbourne house prices increased by 69% over the five-and-a-half years to December 2017, although prices have recently started to retreat. Strong population growth, a dwelling deficiency and falling interest rates have been key drivers of this upturn, with solid economic conditions and employment growth maintaining a positive purchaser sentiment. House prices increased at a much stronger rate than the unit market, which has been affected by oversupply. Since the start of the year, with upgrader and downsizer activity starting to taper, and a decline in investor activity coming through, the median house price declined by 4.3% over the six months to June 2018.
Investors were a significant component of the upturn, encouraged by tight vacancy rates and low interest rates. Prices increased across the metropolitan region, with the strongest growth rates recorded in the inner and middle ring suburbs over the five-and-a-half years to December 2017. Initially, the inner and middle ring suburbs performed better than the outer ring suburbs, but since the beginning of 2015/16, median house prices have increased most in the outer ring suburbs.
Melbourne has benefitted from strong growth in first home buyer activity due to increased stamp duty concessions from 1 July 2017. Although house prices have been declining since the start of 2018 across the metropolitan area, the more affordable outer suburbs have maintained their prices since the start of the year, with very minor declines recorded. The biggest falls, which have caused the decline in metropolitan median house prices, have come from the inner and middle ring suburbs. There was a 24% decline in prices in Inner ring Melbourne, led by City of Melbourne and Stonnington LGA, highlighting the difficulty in selling higher value houses in the current market. While first home buyer activity is strong, non-first home buyer loans have reduced slightly since the end of 2017 and investor demand has been steadily trending downwards as credit conditions continue to tighten.
Read more about Melbourne property prices: download the report.
Brisbane
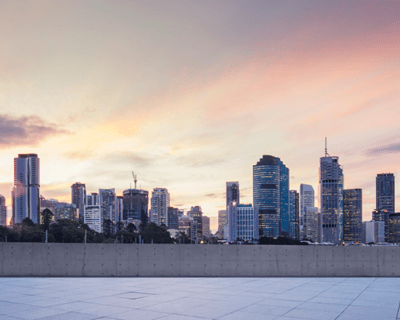
The Brisbane market has been relatively subdued in comparison to the other major east coast capital cities. Brisbane remains affordable in comparison to Sydney and Melbourne, which is likely to continue to support buyer demand.
Over the four years to June 2016, median house price growth in Brisbane averaged 5% per annum, while through 2016/17 and 2017/18, price growth eased to just 1% per annum. Rising supply appears to be having a dampening effect on prices in the city. In aggregate, the Brisbane market is in oversupply although this is largely expected to be concentrated in the unit sector, with the detached housing market close to balance or in slight undersupply. Across metropolitan Brisbane, vacancy rates vary and are significantly higher in Inner Brisbane and lower in Outer Brisbane, which suggests that the housing market is tightening while the unit market is in oversupply. However, vacancy rates across Greater Brisbane have trended downwards, which may suggest higher migration flows are occurring and/or more attractive rents are enticing people into the rental market.
House price growth has been positive (2.9%) in the more affordable Outer suburbs of Brisbane over the year to June 2018, with a modest decline of 0.8% occurring in Middle Brisbane, and a greater 2.9% decline in the higher-priced Inner Brisbane.
Population growth in Queensland has been strengthening, with a reduction in net overseas migration being offset by stronger net inflows from other states. Migrants from overseas have a higher propensity to reside in inner city units, while those from interstate are more likely to support demand in the detached housing market in Brisbane’s suburbs.
New dwelling completions in Queensland have increased markedly in recent years, with average completions in the four years to June 2018 up by 37% compared to the previous four-year period. Although supply has increased primarily for units, there has also been some increase in house completions.
Read more about Brisbane property prices: download the report.
Perth

The decline in house prices in Perth over the past four years began to slow in 2017/18 as the collapse in resource sector investment bottomed out, and signs of population growth recovery started to emerge. Perth’s median house price has fallen by a cumulative 12% since peaking in the June 2014 quarter.
After the slump in mining investment, the unemployment rate in Perth peaked at 7.5% in March 2017. However, by June 2018, the unemployment rate had improved to 5.7%, assisted by many transient mining industry workers returning to their country or state of origin. Small improvements in both overseas and interstate migration occurred in 2017/18, flowing through to increasing population growth.
Still, the deterioration in population growth occurred just as new dwelling completions were increasing. A significant surplus of stock emerged in 2016, and the market has remained oversupplied since then.
Rents in Perth are now 19% below the June 2014 peak. This appears to be attracting tenants, with Perth’s vacancy rate of 5.6% in June 2018 being down from a peak of 7.3% 12 months earlier.
Read more about Perth property prices: download the report.
Adelaide
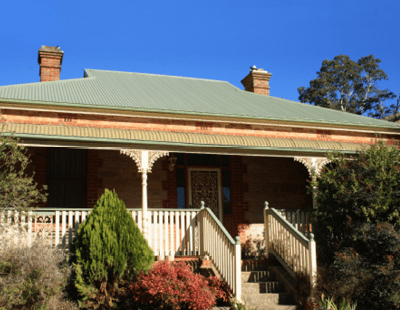
In Adelaide over the past few years there has been consistent moderate house price growth. This has been underpinned by low interest rates and relatively positive affordability compared to other capital cities, despite the difficult economic conditions. Adelaide’s median house price grew an average of 3.8% per annum over the five years to June 2018.
South Australia is currently facing a period of challenging economic conditions. The key manufacturing industry is suffering from low cost overseas competitors, while the automobile manufacturing industry shut down in 2017 which also impacted local suppliers. In addition, public investment has fallen back after a number of major engineering construction projects have been completed.
The price rises have been despite an 11% decline in investor activity – its lowest level in more than four years. Total owner occupier loans in 2017/18 were only 3% below the previous year, with growth in first home buyers more than slightly offset by weaker demand from other owner occupiers. Median house price growth slowed only marginally to 3% in 2017/18, leaving the median house price at $493,900.
Since 2014/15, completions have remained elevated and there exists a significant number of dwellings still in the pipeline. As a result, the South Australian market developed an oversupply in 2015/16 which is projected to continue to increase as new supply remains elevated. It is estimated that the oversupply is concentrated in regional South Australia, although vacancy rates in Adelaide started to edge up in June quarter 2018 to 2.3%. Further upward movement in the vacancy rate is expected in the short term as completions remain high.
Read more about Adelaide property prices: download the report.
Hobart
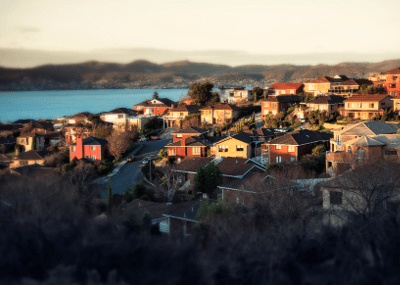
Hobart has witnessed the fastest growing property prices across all the capital cities in Australia, for both houses and units over the last three years. House prices have increased by a third over this period. Even after this increase in prices, Hobart retains the lowest median house price of the state capitals. Its affordability advantage has been a key driver of interstate migration from increasingly strained affordability in Melbourne and Sydney.
Hobart’s median house price increased by 10.6% in 2017/18, bringing the median house price to $481,800 at June 2018. Price growth was strongest in Brighton (17.3% growth over the year) and Glenorchy (14.5%), while Hobart City had the weakest growth rate of all the metropolitan area regions (6.3%), suggesting that demand is spilling out to the more affordable regions.
In previous cycles, net interstate migration inflows have mainly come from ‘tree changers’ downsizing from the more expensive Melbourne and Sydney markets. However, the current inflow is largely coming from a younger demographic, suggesting this population seeks refuge from higher prices on the mainland.
The Tasmanian economy has improved in recent years. A lower dollar has underpinned a booming tourism sector and given a boost to the agricultural sector, which competes in the niche high value export markets.
The demand for dwellings has been relatively strong, outstripping new supply. Vacancy rates have decreased from around 5% in the middle of 2012, to just 1.7% in the June 2018 quarter.
Read more about Hobart property prices: download the report.
Canberra

With public sector employment accounting for more than 40% of jobs in the Australian Capital Territory, underlying demand in Canberra is strongly related to movements in the level of employment within the Federal government.
Public sector employment began ramping up through 2016/17 after three years of fiscal austerity. Unemployment in the Australian Capital Territory has since tightened, falling to 3.5% at June 2018, the lowest of all Australian states or territories. This has brought with it stronger net interstate migration inflows. Net overseas migration has also improved, being driven by increased numbers of international students.
Escalating new dwelling completions first tipped the Canberra market into oversupply in 2012/13. However, a strengthening in underlying demand saw the market move back towards balance in 2018. Vacancy rates in Canberra were a tight 0.8% at June 2018.
The increase in supply of dwellings has been solely concentrated in the unit sector. As a reslt, there exists a dichotomy between the unit and detached housing market. While unit completions increased, completions of detached houses have dramatically fallen from 1,839 dwellings in 2012/13, to an estimated 900 dwellings in 2017/18.
After average growth of 8.0% per annum over the previous two years, Canberra’s median house price increased by just 0.7% in 2017/18, to $675,000. A factor is likely to be an oversupply in the unit market, with many prospective home buyers either opting to remain as tenants given more attractive rents on offer, or alternately buying a more affordable unit instead of a house. Some housing demand may also have shifted out of Canberra and into neighbouring centres across the border into New South Wales, such as Queanbeyan, as the result of the NSW First Home Owners stamp duty exemption and more affordable house prices.
Read more about Canberra property prices: download the report.
Darwin
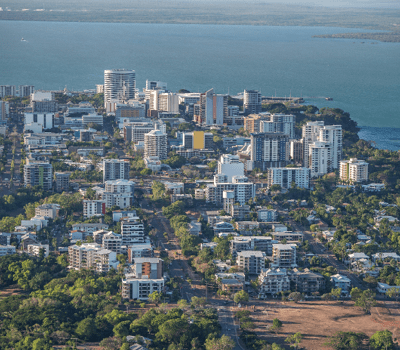
Darwin’s median house price has often run independently of the prevailing national economic cycle of the time. The small size of the Darwin market makes it more susceptible to local events and the median price can be variable. Darwin typically has a higher and more variable vacancy rate, a product of a large transient working population.
The median Darwin house price declined by 20%, representing a $126,000 price drop, between June 2014 and September 2017. This was also a period in which supply outstripped demand leading to higher vacancy rates and a collapse in investor demand. Prices have continued to decline, decreasing by a further 7.4% over 2017/18 to $500,000. The median house price in Inner Darwin fell 12.5% while the Northern Suburbs and Palmerston saw smaller declines of 6.5% and 7.6% respectively.
Over the past three years investor demand has collapsed due to declines in rents and prices. Tighter lending conditions for investors also likely had a negative impact more recently. Vacancy rates increased significantly making Darwin a less desirable location for investors. The unemployment rate in Darwin is below 4%, but this is due more to rising overseas and interstate departures, rather than a buoyant job market. On the other hand, improved affordability (following the price decreases), coupled with significant first home buyer grants and stamp duty concessions has lured first home buyers back into the market. First home buyer lending has increased significantly, being up by 64% in 2017/18 on levels two years earlier.
The commencement of new projects has plummeted, reflecting deteriorating financial feasibility, as both demand and prices have retreated. The volume of house commencements in Darwin was around 44% lower in 2017/18 than the preceding three years. The decline in new unit projects over this same period was even more apparent, as unit commencements were 75% lower in 2017/18 than in 2014/15.
Read more about Darwin property prices: download the report.
